Top WooCommerce Metrics and KPIs to Monitor

WooCommerce is one of the world’s most popular eCommerce solutions, and certainly the best WordPress plugin for online shops (although there are a few interesting WooCommerce alternatives). Although it may seem complicated, setting up an online store using this solution is actually quite streamlined and easy even for newbies, especially if you have a good WooCommerce guide you can follow. But how about tracking your results? That’s precisely what we want to talk about this time around, sharing with you the most important WooCommerce metrics and KPIs you need to monitor in order to run a successful shop that keeps growing.
Stick around as we tell you all there is about:
eCommerce WordPress Themes
View Collection


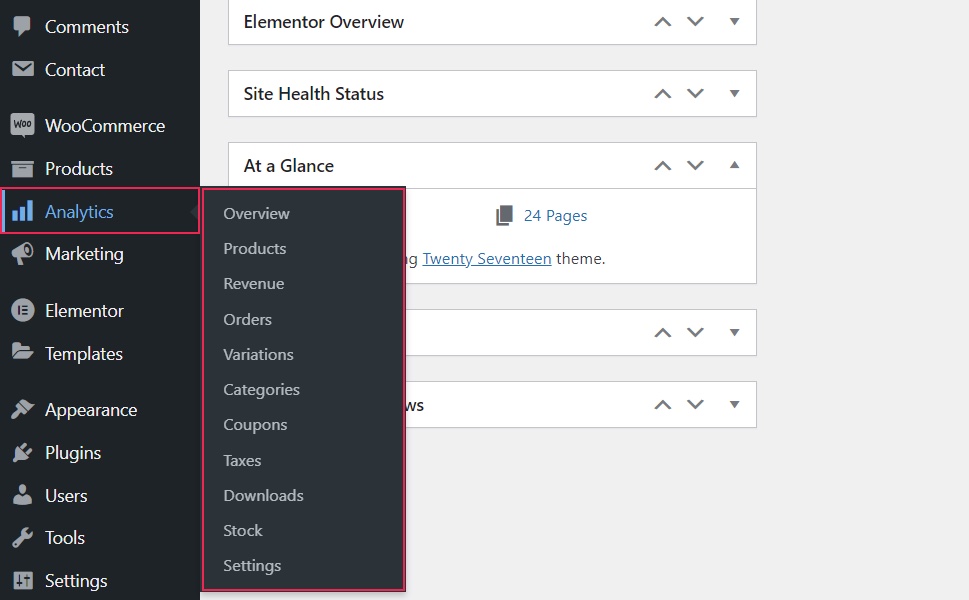
Fortunately for WooCommerce users, the plugin comes with built-in analytics. These can be accessed right from your dashboard.
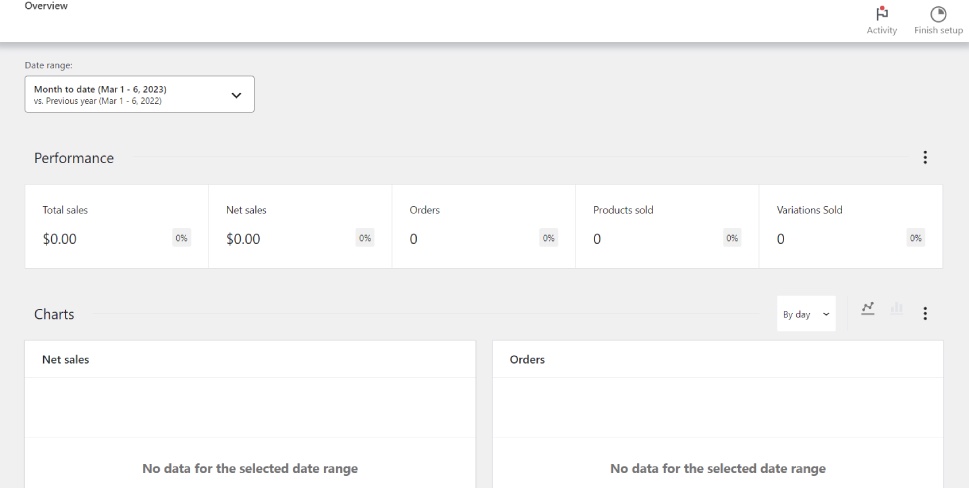
In the Overview, you get a quick look at your total and net sales for a given period, the number of orders as well as products and variations sold – the essential data. There are also charts and leaderboards showing you your best selling items, as well as categories.
Ours is a dummy shop so there’s no data here to see – your shop will have actual numbers.
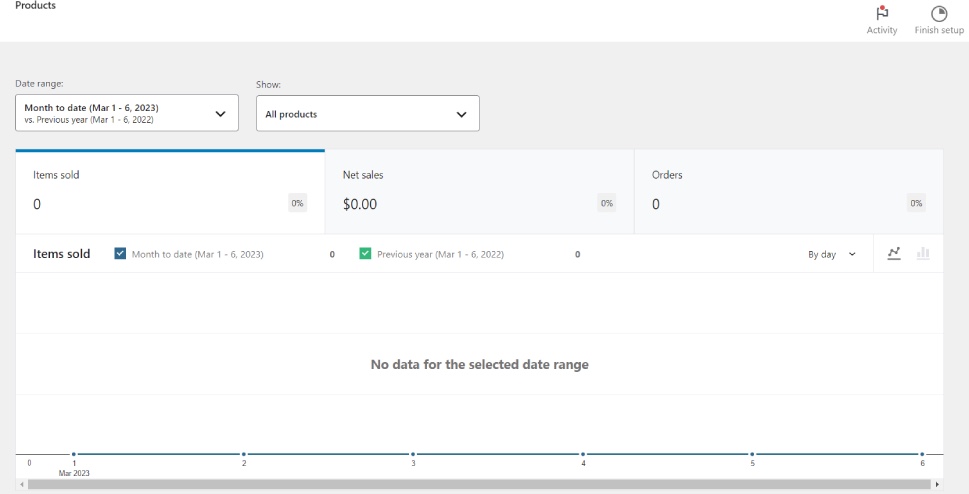
The Products section shows more detailed info about the number of items sold, net sales and orders. Here you can filter the insights so they display data for all products, a single product, or compare two products to see how they fare against each other.
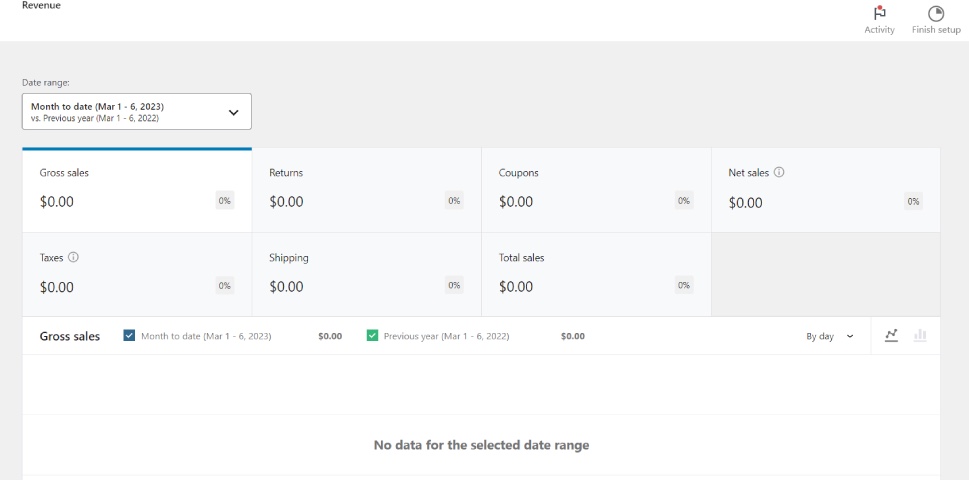
The next section is Revenue. Here you’ll find data about your gross and net sales, returns, coupons, taxes and shipping costs, as well as total sales. All data can be filtered by day and presented as a line chart or bar graph.
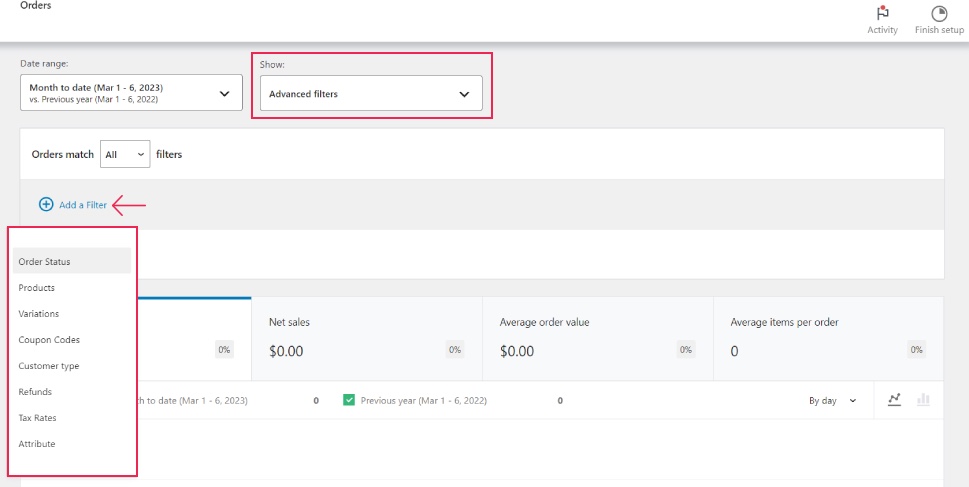
Next up are the Orders. Here you can learn about your net sales, average order value and average items per order. You can also filter the results by applying advanced filters like variations, coupon codes, customer types, refunds and more.
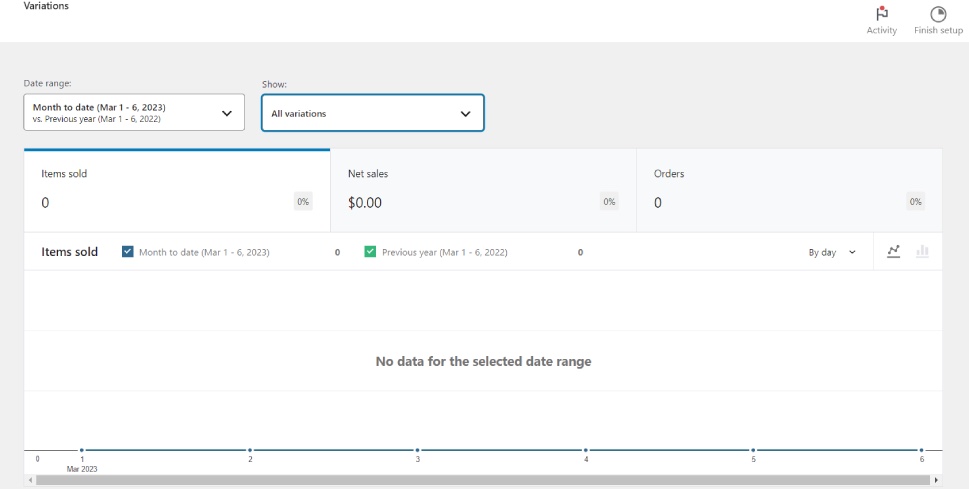
After this, we have the Variations, the metrics that also come divided into net sales, items sold and the number of orders. You can display data for all product variations, a single variation, variations comparison, or apply advanced filters (categories, products, attributes).
Next up are the Categories, showing data for all categories or individual categories that you have to specify.
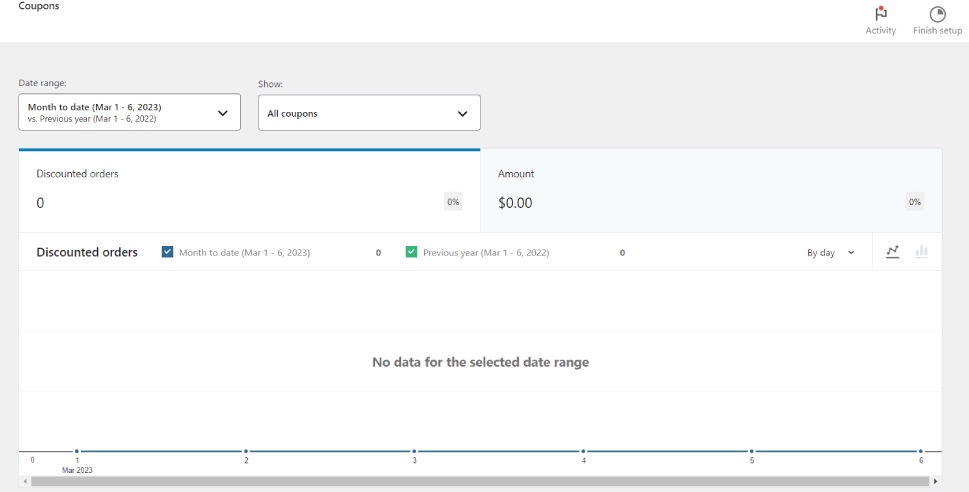
After that we have Coupons. If you’re offering discount coupons in your shop, here you’ll find data about the discounted orders and the amount, and you can display data for all coupons, a single coupon or coupon comparison.
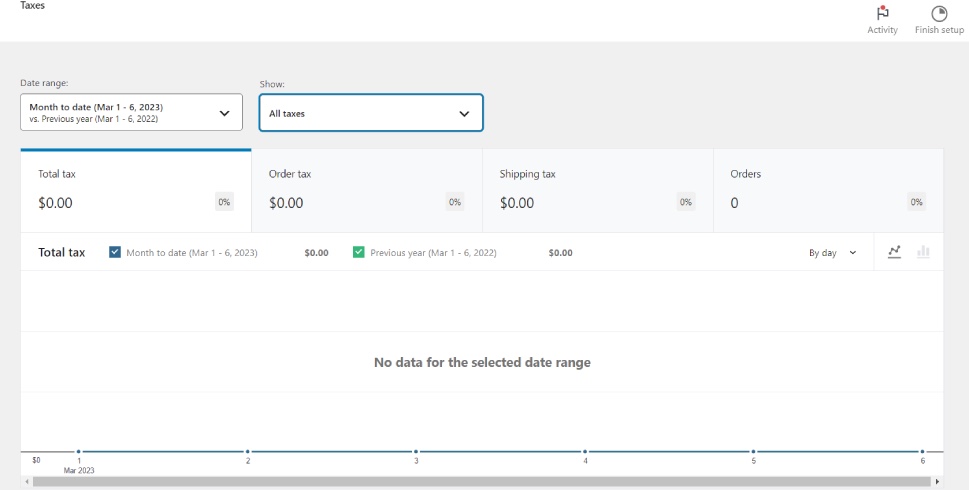
Up next are the stats regarding the dreaded Taxes except there’s nothing to dread here as WooCommerce has rather straightforward tax settings which we covered and explained in detail in our guide to WooCommerce tax settings.
Here, you’ll find info on total tax, order and shipping tax and orders.
The Downloads section is relevant for shops selling digital goods and it’s rather stripped-down: it basically only shows the number of downloaded items for the specified period.
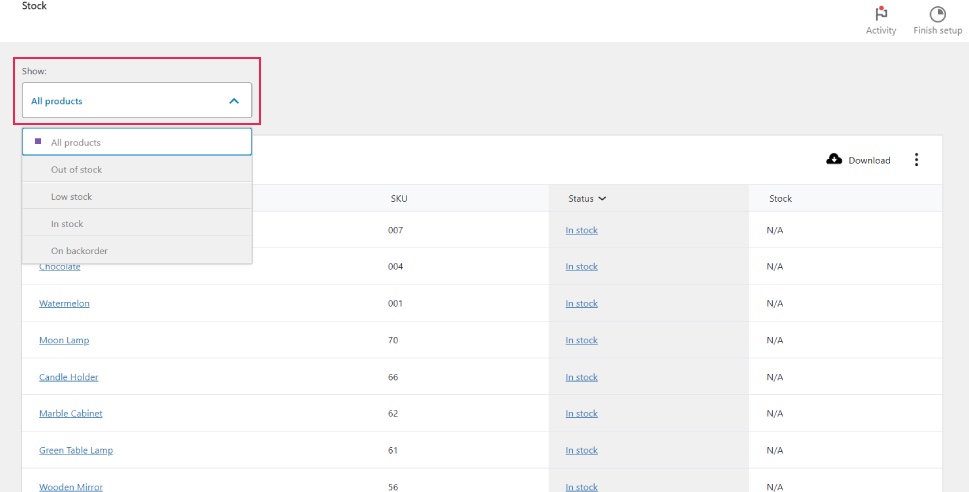
Next up is Stock. Here you can show stock status for all products or filter to show only products that are out of stock, low stock, in stock or on backorder.
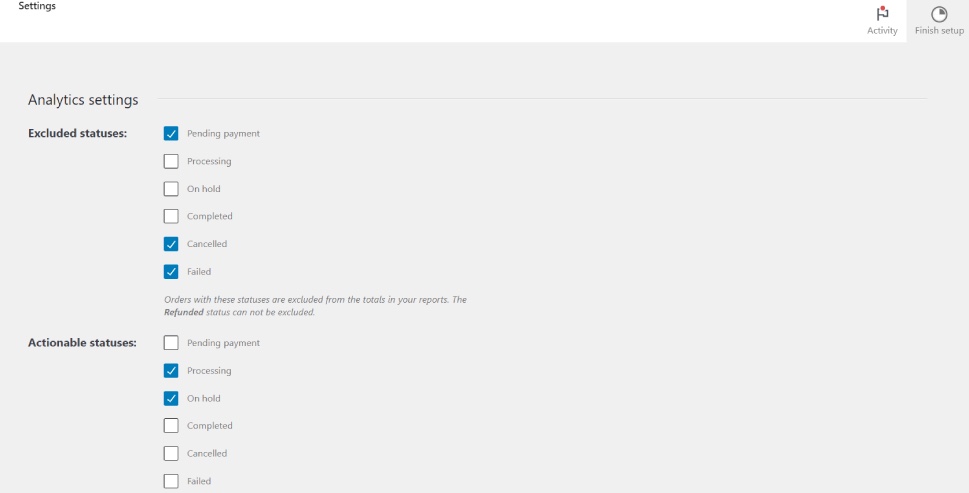
The Settings section contains some options you can check and uncheck to customize your reporting.
For instance, you can exclude reporting on certain statuses: for orders pending payment, those in processing or on hold, completed orders, canceled and failed orders. The same goes for actionable statuses.
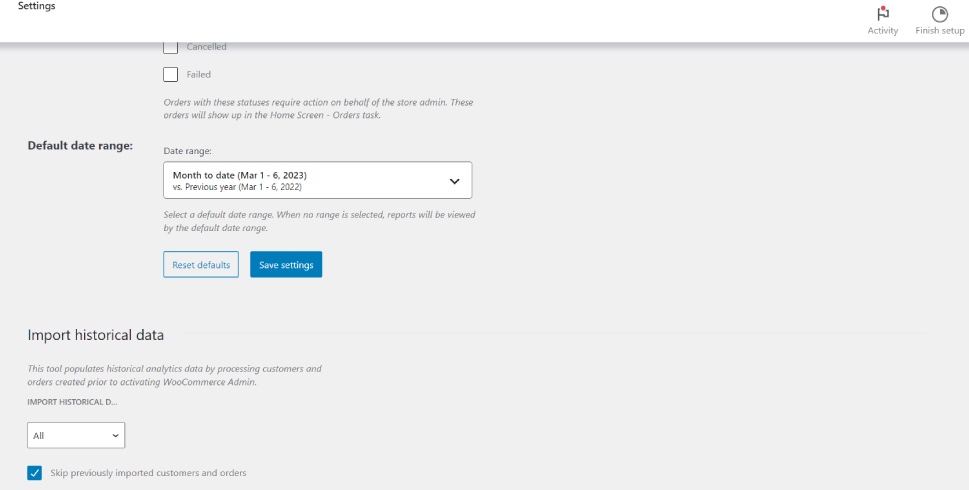
Below you can also set the default date range for your WooCommerce analytics and import historical data, which includes orders created before activating the WooCommerce Admin.
And that’s it for the dashboard options for WooCommerce analytics.
Now, for some shops, this native analytics feature may not be enough, or you may simply prefer working with the more robust Google Analytics metrics. For this, you will want to install an extension called WooCommerce Google Analytics Integration. In its free version, it offers basic eCommerce and website statistics and analytics, while the pro version, which costs $79/year, provides richer insights with advanced event tracking, shopping and behavior data, additional events and more.
Now that we know where to find WooCommerce analytics data, let’s move on to our subject – the most important WooCommerce metrics and KPIs.
First, we’ll offer a quick recap of what metrics and KPIs mean, and what the difference between the two is.
Simply put, a metric is a quantitative representation of data. It is a number or a percentage that measures a given datapoint. It serves to measure the factors that contribute to the business bottom line – its success and its growth. In WooCommerce, metrics measure sales, conversion rate, revenue per product, net revenue, and so on.
It’s obvious why these numbers are important. If you notice a drop in some of the metrics, you need to figure out what caused it and how to fix it (not all drops are harmful for all metrics, though – a drop in cart abandonment rate, for example, is a good thing, as it means less people are leaving your shop without completing a purchase).
We already saw some of the metrics measured in WooCommerce:
-
Net Sales
-
Gross Sales
-
Orders
-
Products Sold
-
Variations Sold
-
Items per Order
-
Top Categories
-
Top Products
-
Sales Revenue
-
Average Order Value
-
Conversion Rate
-
Customer Acquisition Cost
-
Customer Lifetime Value
-
Stock Levels
-
Cart Abandonment Rate
-
Shipping Costs
… and so on.
Now, KPI stands for Key Performance Indicator. It is a measurement or a set of measurements that shows how a business performs over a given time period in certain specific aspects. The KPIs are set per specific goals and strategic objectives.
KPIs usually are metrics, but they’re not just any metrics. Whether a metric will also be a KPI will depend on your strategic goals. You will not consider all your metrics to be KPIs, as some of them might not be as relevant to your current goals as the others.
In WooCommerce, some of the KPIs may include:
-
Conversion Rate
-
Average Order Value
-
Customer Acquisition Cost
-
Cart Abandonment Rate
-
Return of Investment
-
Customer Lifetime Value
…and so on.
Now, while you should always carefully monitor all the metrics that your analytics gives you, there are some numbers that are particularly important to monitor. Let’s see what those are.
This is an obvious one. It’s a metric that shows how much your shop is selling, i.e. how much revenue it’s generating. Like any other metric, this one should be monitored for particular periods of time – you can set it both in the backend of your WooCommerce analytics or in Google Analytics, if that’s what you’re using.
These numbers are also important because they can help you pinpoint the exact days or hour ranges when your sales are doing better, so that you can set the optimal time for your product launches or promotions.
Don’t forget to check for quarterly and yearly sales, as these numbers help with your strategic planning.

This is a metric that is essential for any online business or any business whose revenue relies at least partially on online activities. Conversion means the point at which your shop visitor performs a desired action – it’s usually a purchase, but it can be other things too – add to cart, newsletter signup, etc.
Now, in eCommerce, the conversion rate is usually a very low number, something around 2% or 3%, so don’t panic if your analytics gives you a similar result. People are windowshoppers by nature, especially online, and your shop is simply bound to have way more visitors than it does shoppers.
If your conversion rate is low and appears to be consistently dropping, you need to adjust your digital marketing strategy to get not just more traffic but more qualified leads to your shop, which you can do by following some fail-safe tips for increasing WooCommerce conversions.
In WooCommerce, the number of transactions typically refers to the total number of completed orders placed on your online store. This includes all purchases made by customers, whether they are paying by credit card, PayPal, or any other payment method.
This measurement should be compared to the target number of transactions you have set for your store. In addition, it is important to compare it to the same metric of your competitors or industry peers, in order to establish whether you’re hitting the benchmarks and if your marketing efforts are working. It should also be used in making informed decisions about inventory and products.
Cost per Acquisition (CPA) is a metric that indicates the total cost of acquiring a new customer or making a sale (including advertising and marketing costs), divided by the number of conversions or sales made. It is a measure of how much it costs a business to acquire a new customer or generate a sale.
For example, if an ecommerce business spends $1,000 on advertising and marketing campaigns in a month, and generates 50 new customers, the CPA would be $20 ($1,000 / 50). This means that the business spent $20 to acquire each new customer.
CPA is an important metric for ecommerce businesses because it helps determine the profitability of their marketing campaigns and the overall efficiency of sales and marketing efforts. By tracking CPA, you can identify which marketing channels and campaigns are generating the most sales at the lowest cost, and adjust your strategy accordingly to maximize profitability.
Cost of Goods Sold (CGS) indicates the total cost of creating i.e. producing an item in your catalog. It includes the materials and manufacturing costs, as well as shipping and handling. Other costs, such as marketing, sales and operations, are generally not included in this measurement.
To calculate this measurement, you need to add up all the costs of producing or acquiring a product and then subtract it from the revenue generated by the sale of the product to obtain the gross profit margin.
This metric is important because it helps you determine whether a product in your shop is profitable. If it’s not, you may want to consider discontinuing it.

This is a metric that refers to the returning customers. We know that keeping a customer is way easier than obtaining a new one, so you need to cultivate the relationship with him or her and work on improving retention. Customer Lifetime Value (CLF) indicates how much value you can expect from a customer.
This measurement doesn’t come up in your analytics dashboard and needs to be calculated. To do so, multiply the customer revenue per year with the duration of the customer journey, and then subtract the total cost of acquiring and retaining the customer.
If you have high CLV values, it means you’re doing a great job at customer retention. Low numbers, conversely, indicate you have to change something to improve customer satisfaction, be it related to the product quality, pricing strategy, shipping and delivery, return policy or shop UX.
Closely associated with Customer Lifetime Value, Returning Customer Rate (RCR) is another metric that provides information about customer trust and satisfaction, and serves to help you make informed decisions on how to improve the customer journey.
The formula for calculating RCR is:
RCR = (Number of customers who made more than one purchase / Total number of customers) x 100
For example, if you had 1,000 customers make at least one purchase in the past year, and 300 of them made more than one purchase, your RCR would be:
RCR = (300 / 1,000) x 100 = 30%
This means that 30% of your customers made more than one purchase during the year, indicating a good level of loyalty and satisfaction with your ecommerce business.

This is a metric that indicates the percentage of your shop visitors that have added an item (or more) to their shopping cart, regardless of the outcome. Obviously you want this percentage to be high, as it indicates your shop’s ability to attract the customers and spark their interest in making a purchase. It is also important from a UX standpoint – low add to cart rates may indicate that your shop’s cart functionality isn’t ideally designed or streamlined enough. If this is the case, you may want to use one of the available shopping cart plugins that optimize this feature.
Also, high add to cart rates alone aren’t indicative of success. You need to correlate this metric with one of the most important WooCommerce metrics – Cart Abandonment Rate.
Quite logically, Cart Abandonment Rate or CRA represents the percentage of site visitors that have put item(s) in their cart but did not complete the purchase. Whether they changed their mind or there was some glitch or difficulty in the functioning of your online shop, it’s obvious that this metric should be as low as possible.
There are many reasons a shopper might leave your site without completing a purchase. These include bugs and problems with your site before or during checkout, slow loading times, bad checkout UX or customers simply changing their mind (which may be related to pricing).
Abandoned cart recovery tools can help you bring those customers back, and there are also tactics and methods you can employ to reduce the cart abandonment rate of your shop.

This is another metric that can tell you a lot about the level of customer satisfaction with your online store.
Net Promoter Score (NPS) is a customer loyalty metric that measures how likely customers are to recommend a company, product, or service to their friends or colleagues.
NPS is based on a single question survey: “On a scale of 0-10, how likely are you to recommend [company/product/service] to a friend or colleague?” Customers respond to this question by selecting a score from 0 (not at all likely) to 10 (extremely likely).
The results are then divided into promoters, passives and detractors. To calculate the Net Promoter Score, you subtract the percentage of detractors from the percentage of promoters. The score can range from -100 to +100.
For example, if 40% of customers are promoters, 30% are passives, and 30% are detractors, the Net Promoter Score would be:
NPS = 40% – 30% = 10
A positive NPS indicates that the company has more promoters than detractors, which suggests that customers are generally satisfied with the company and its products/services. A negative NPS indicates that the company has more detractors than promoters, which suggests that there may be issues with customer satisfaction and loyalty that need to be addressed.
Unlike other metrics and KPIs here, NPS cannot be found in your analytics tools or dashboards. Instead, you need to use a surveying tool.
This is a metric that indicates how much your shop is generating minus expenses like taxes, overheads, COGS, etc. It can be calculated following a very simple formula:
Average Profit Margin = ((Total Revenue – Expenses) / Total Revenue) x 100
This metric is often used as a KPI. Generally speaking, ecommerce businesses with low overhead costs and high margins on products can achieve higher profit margins. The average ecommerce profit margin is around 10% and the most successful ones have it between 22% and 25%, although this can vary greatly depending on specific lines of business.
While it may sound like “the king of all metrics,” gross profit is a measurement that is very relative and should never be considered separately from other numbers you’re getting.
Gross profit is basically the total profit you’ve made in a given period. It’s a useful KPI for growth-oriented WooCommerce shops.
To calculate your gross profit, simply subtract the COGS (Cost of Goods Sold) from your total sales.
Wrapping It Up
What we shared here are just some of the most important metrics and KPIs you should monitor in your WooCommerce store. That’s not to say they are the only ones you should monitor. In fact, depending on the nature and purpose of your store, as well as its size and dynamics, you may want to add some specific metrics relevant for you. However, the ones listed here should be more or less universal for any sort of store. Things like sales and gross profit, shopping cart abandonment and conversions are measurements that interest anyone looking to make profit from a WooCommerce shop.
If you feel we missed an important metric or KPI, do let us know in the comments! WordPress is a community, and we should always work together to help each other grow.
