7 Best Data Visualisation Plugins for WordPress

Data insights are important for brands. Based on collected data, companies can create successful brand strategies, work on improving their products, and increase performance and revenue. Furthermore, they can understand how to provide customers with more satisfactory services, and resolve other important business issues.
But big data is often hard to comprehend. An enormous amount of numbers and cluttered spreadsheets will hardly put a smile on anyone’s face. To present complex data in a transparent way, use data visualization.
Data visualization is the process of converting numbers i.e. data into graphic formats, such as charts, diagrams, pictograms, infographics, and maps. This kind of visual content enables clearer perception and easier comprehension of big data, benefiting both the brand and the user. To add it to your site, you have to use WordPress data visualization plugins.
Below you’ll find an assortment of the best plugins on the market that will ensure you seamlessly organize and beautifully display data on your pages. We will talk about:
Qode Themes: Top Picks
View Collection


The Qi Addons for Elementor plugin packs an impressive assortment of practical widgets you can use to add a number of terrific elements to your site. Out of the 60 addons included with the plugin, 7 are devised to help you display your data in a clear and visually appealing way.
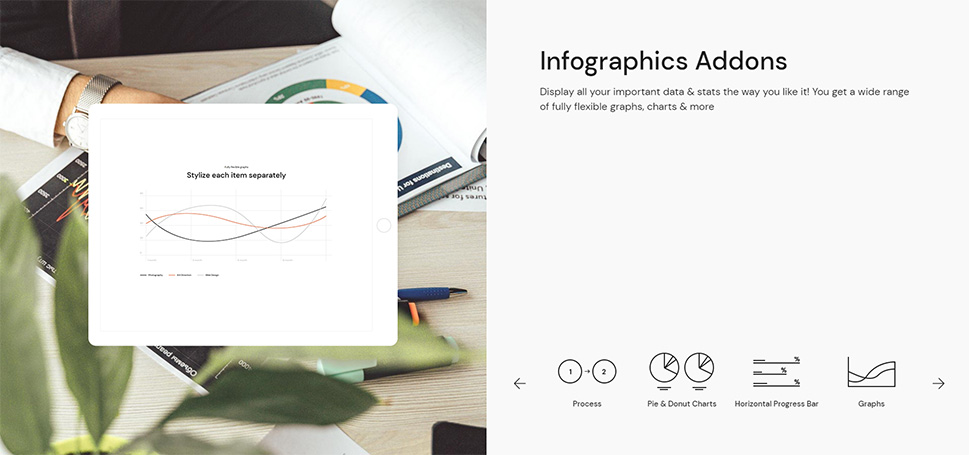
Depending on your needs, you can help users better grasp intricate information by adding counters, radial progress bars, or horizontal and vertical progress bars to your site. Moreover, you have the possibility to detail process stages as well as insert graphs and pie and donut charts. No matter the widget you choose, you will easily find your way around them as they are all super intuitive. They include a myriad of powerful options allowing you to customize the appearance of your infographics to the smallest of details and make them suit your preferences and requirements. The Qi Addons for Elementor Plugin is a powerful tool that adds a number of functionalities to your website and you can download it completely free of charge.

Formidable is a plugin we reviewed earlier in our article on the best WordPress contact form plugins. You can use it to create different types of customizable forms, but also display the collected data with graphs and charts. That way, you don’t have to look for additional plugins to visually present the stats as Formidable has got it all covered.
To use the Reports, Graph and Charts feature, you need to buy any of the three premium plans. When you do and you get the stats you’ve been waiting for, you can visually present them by using column graphs, line graphs, horizontal bar graphs, pie charts, area graphs, scatter graphs, stepped area graphs, geographic heat maps, and histograms.
The graphics can be added to any section of your site and styled according to your requirements with the help of shortcodes. The premium version of the plugin features a selection of shortcodes you can use to complete a variety of different actions, and customizing the graphics’ appearance on the screen is one of them.
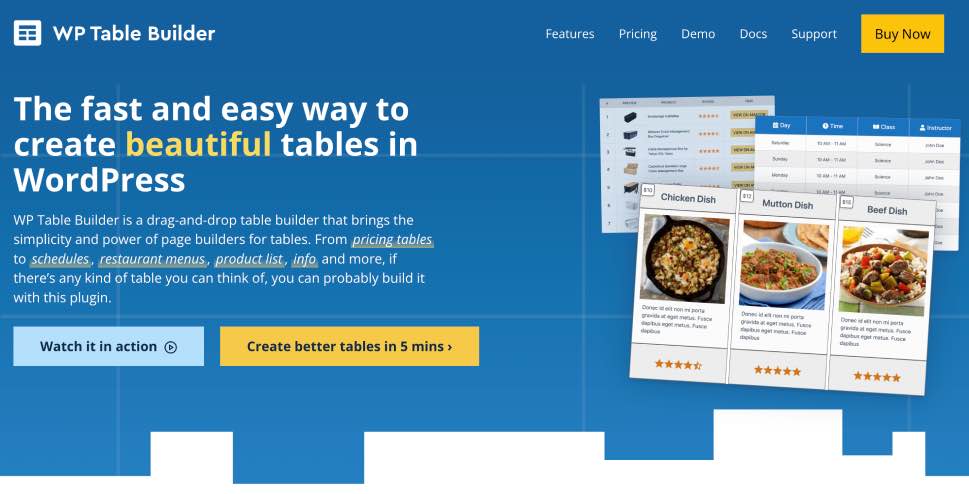
Since a table helps you to show your data in an organized way, WP Table Builder can help you show your data within a beautiful table.
For instance, you can show your product data that includes star rating, title, image, button, list icons, product details, affiliate links, etc. It is incredibly easy to create a mobile responsive table using WP Table Builder.
After installing the plugin, you will not need to write any coding and syntax. Its intuitive drag & drop live editor generates highly customizable tables automatically after putting the row and column number.
Moreover, the plugin comes with a handful amount of professionally designed table templates to get started quickly. There are other advanced functionalities such as open links in a new tab, tag links as nofollow, showing ordered & unordered lists, and much more.
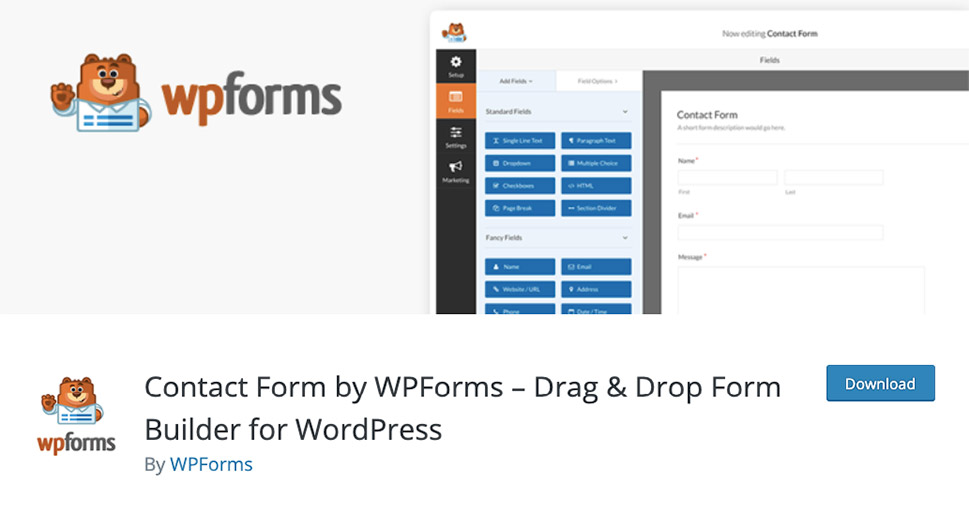
WPForms is yet another plugin we talked about when discussing contact form plugins, but there is more to it than creating contact forms. If you purchase the Pro and Elite premium plans, you get the opportunity to use a myriad of add-ons that turn this plugin into a powerful tool that can do almost anything, from collecting users’ geolocation data and connecting your site to PayPal, to creating surveys and analyzing data.
Surveys & Polls is a handy add-on for WPForms that helps you not only understand how your customers feel about your brand and the services you provide but also generate reports based on the users’ responses. You can add it to any page, post, or widget area on your WordPress website. It comes with a drag-and-drop form builder, which facilitates the process of crafting new surveys and polls. You can create them from scratch or integrate the options the add-on comes with into the forms you’ve previously built.
Surveys & Polls allows you to add a likert scale to your surveys, let users submit star ratings, as well as create multiple-choice and NPS (Net Promoter Score) surveys. You also have the option to enable survey reports and polls reports with a single mouse click from your dashboard. Moreover, you can add survey reports for individual fields and not just the entire survey.
One of the many cool features of this add-on is the option to activate real-time reports. You can display the results as a bar chart, a pie chart, or use one of the few other data visualization options. It’s also possible to export the results as a .JPG or a .PDF file.
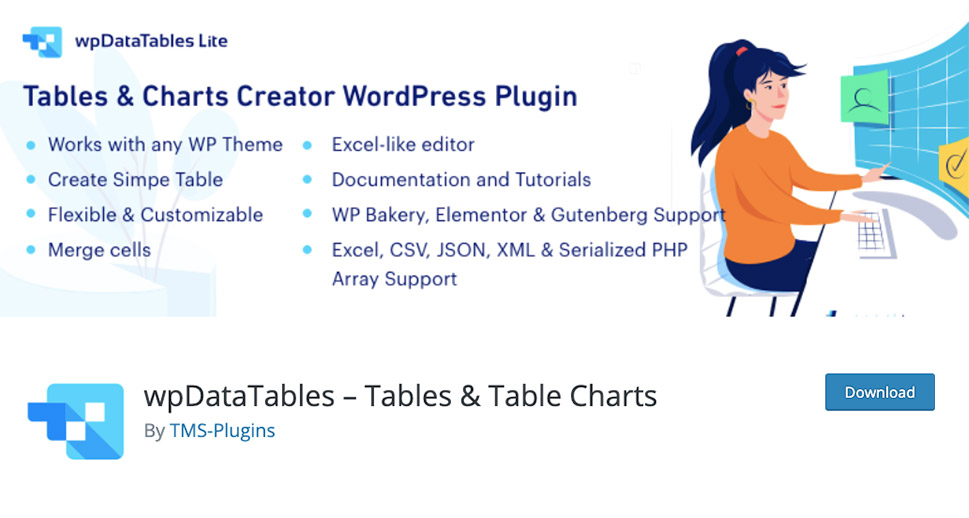
wpData Tables is a freemium plugin that helps you easily make tables and charts on your WordPress website.
You can use it to make graphics by uploading your Excel, CSV, PHP, JSON, and XML files. Moreover, premium plans come with the option to insert data manually as well as insert it from MySQL, MS SQL, and PostgreSQL databases.
This plugin lets you create numerous different types of charts, including histograms, line charts, pie charts, column charts, donut charts, bar charts, scatter charts, etc. You can rename graphics, reorder chart elements, alter colors as well as fonts, add CSS classes, enter time and date stamps, merge cells, group rows, and much more. There’s an option to highlight rows, columns, and cells, which helps make charts easier to comprehend. The plugin also includes the advanced filtering feature which enables users to create filters for every column and see only the data of their interest.
Data Tables Generator is another great solution that enables you to create and manage tables. The free version of the plugin includes some basic functionalities, such as adding basic table elements (rows, columns, headers, footers, etc.) and altering them to fit your needs. But to be able to customize tables to the full extent, you’d have to purchase a premium license.
The pro version of this plugin allows you to enable front-end editing, add collapsable rows and diagrams, export the table in PDF, CSV, and XLS format or via email, hide specific cells on the front-end, to name a few.
This plugin is particularly of use for anyone using the WooCommerce plugin. The pro version of Data Tables Generator includes the WooCommerce Product Table feature which ensures an easy creation of list products. Thanks to this option, users can quickly navigate through your offer and display data in whatever order they want.

M Chart is a clean, easy-to-understand plugin that uses Chart.js and Highcharts chart libraries. This is a lightweight solution that you can use to create line, column, bar, and pie charts.
There aren’t too many customization options, but there are settings that allow you to adjust the size of the chart, create categories, tags, and attributes, export/import a CSV file, allow comments, and add excerpts. You can choose between four default templates and use a different one for every chart.
There is also a practical live chart preview meaning you can see the way your chart looks before you share it online and, if necessary, make adjustments to it.
Let’s Wrap This Up
Data visualization ensures a better understanding of often too complicated textual or numerical data. It helps people track progress, realize dependencies between various types of data, and determine errors and risks. Moreover, data visualization helps brands realize which areas of their business need improving. And no matter which one of these plugins you install on your site, you’ll be able to do just that – grasp huge data, present it in a visually appealing way, and plan your next business steps more efficiently to enhance your power.
