WordPress Debug Mode Explained

If only someone could guarantee that your WordPress website would run for its life without any issues and errors. Unfortunately, running a website means you’ll have an occasional problem. It might be a slow admin dashboard, failure to update or publish posts, or a broken image link or two – sooner or later, something bad will happen, something will break, or stop working as intended. Enabling WordPress’ debug mode can sometimes be a part of the process of fixing the issues.
In this article, we’ll be talking about debugging and WordPress. Usually the purview of developers, debugging is something regular WordPress users, with little to no experience with coding, typically don’t come across. And it’s a shame because it’s a handy tool.
So, sit back and get ready to learn:
Qode Themes: Top Picks
View Collection


Debugging, as its name suggests, is finding and removing bugs from software. Typically, it’s something people who create or are familiar with the software’s code perform. It’s a standard part of software development and use – no code is perfect and debugging helps find errors and fix them.
WordPress, a CMS written in PHP, is software with handy debugging tools. These tools won’t solve your website’s problems, which will likely require human intervention, but they will alert you to specific errors and warnings.
While WordPress has built-in debugging tools, they’re not turned on by default – you have to do it on your own. You can do it manually, with the help of a plugin, or through your web hosting dashboard if that’s an option your host offers.
To do it manually, you need access to the wp-config.php file. We have a thorough guide on editing the wp-config.php, so please give it a look to find out the ins and outs of accessing and editing the file using FTP.
Once you locate and open the file, locate the following line of code:
/* That’s all, stop editing! Happy publishing. */
Any changes you make to the file should go above that line. The code you could add might look something like this:
define( 'WP_DEBUG', true );
define( 'WP_DEBUG_LOG', true );
define( 'WP_DEBUG_DISPLAY', false );
@ini_set( 'display_errors', 0 );
define( 'SCRIPT_DEBUG', true );
You enable the debug mode in the first line by setting WP_DEBUG to ‘true.’ This means WordPress will start showing you debug messages.
In the second line, by setting WP_DEBUG_LOG to ‘true,’ you’re making sure those messages are stored in a debug log. You must enable the log if you want permanent debug message storage.
In the third and fourth lines, you’re disabling the display of messages by setting WP_DEBUG_DISPLAY to ‘false.’ If you skip this step, the messages will show on your website, presenting a security risk and potentially preventing the pages from loading correctly.
Setting SCRIPT_DEBUG to ‘true’ will ensure WordPress uses the full, non-minified versions of core CSS and PHP.
If you’re uncomfortable editing the wp-config.php file manually, or if you don’t have FTP access to the website, you can always turn to plugins for help. There are a couple of plugins you could use for debugging.
We’ll start with the one that lets you directly enable debug mode. Called WP Debugging, the plugin allows you to enable debug mode and enable many of the tools you can also enable manually.
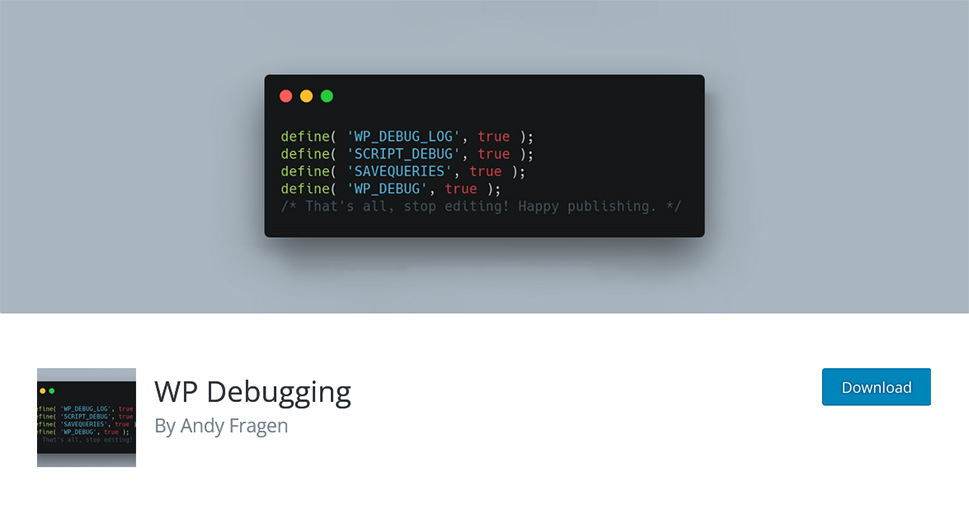
To get started, navigate to Plugins > Add New, search for the plugin, and install and activate it. From there, move to Tools > WP Debugging, where you’ll see all the constants the plugin is enabling/disabling.
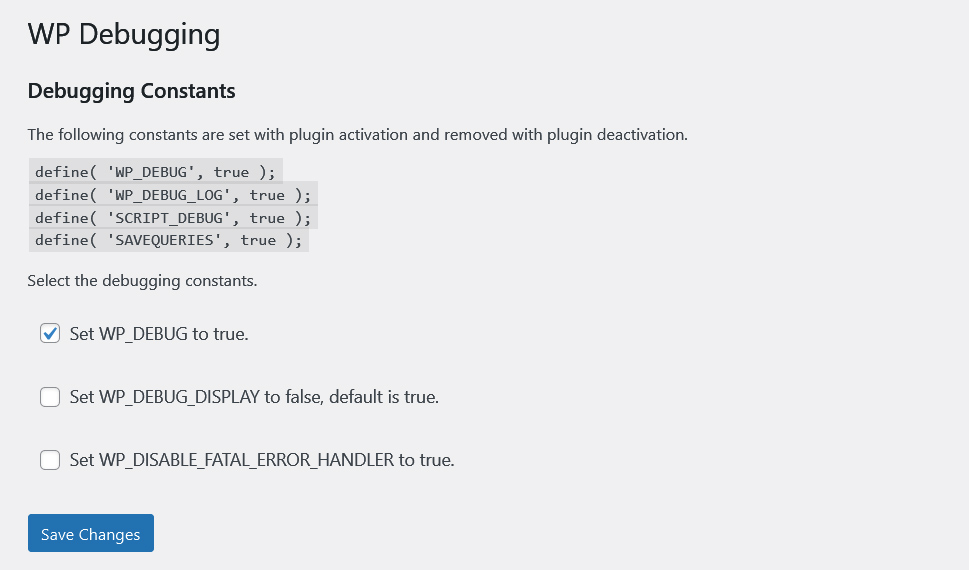
Installing the plugin enables debug mode, message logging, full CSS and PHP file usage, and saving database queries to an array for later display using SAVEQUERIES.
Optionally, the plugin lets you disable the display of debug messages, which might be recommended, and it also enables you to disable the fatal error handler introduced with WordPress 5.2. When you uninstall the plugin, it will try to revert all the settings to default.
After you’ve set up the debug mode and enabled the log, the troubleshooting can begin. After replicating the condition that led to the error, you can access the log and see what notifications and warnings the debug mode issued. Armed with that knowledge, you – or any other person skilled with debugging – can proceed with any necessary steps. These steps could involve fixing your website’s code and letting theme or plugin developers know of the issues their products have caused you.
You can also use additional plugins when debugging your website to make the process easier or to expand its scope. Query Monitor is a plugin we’ve covered in an article. It’s a tremendously helpful plugin that lets you see database queries, PHP errors, enqueued scripts and stylesheets, HTTP API requests, and a whole host of other information on every page load. It’s a necessary plugin for troubleshooting WordPress.
Debug Bar is another commonly recommended plugin to help you out when debugging your website. The plugin gives you access to a debug menu right from the admin bar, where you can see queries and cache. It also lets you keep track of PHP warnings and notices if you have the debug mode on.
You should note that some other plugins might have features that could help you when debugging your website. Jetpack, for example, has an activity log that keeps track of all the changes made to the website, complete with the data on the users who created them. This information can be invaluable when identifying the cause of some issues.
Let’s Wrap It Up!
Debugging is a normal part of ensuring that your website works well. It’s a part of the process when building things like themes and plugins – or at least it should be – just like it’s a part of ensuring that your website, as a whole, works well. Because when it doesn’t, and that’s bound to happen, it’s the debug mode you’ll turn to to find out what went wrong.
