7 Tips and Tricks for Using Your Browser’s Inspect Element Tool in WordPress

Can we ever have enough ways to manipulate all the various elements of our websites? We can do it with themes, website builders, and by adding custom CSS and custom code. Do we really need another way to see the code that makes our web pages and mess with it?
Yes, if by that we mean using the browser inspect element tool in WordPress. It’s not like any of the regular ways to manipulate the website, and it offers some really fun and unique features.
In this article, we’ll show you:
The Inspect Element tool is a feature commonly found in modern browsers such as Firefox and Chrome. It’s also known by the name Developers Tools, or simply DevTools. They are, as their name says, a group of tools built into the browser that lets you do some pretty great stuff – but mostly view and change the contents and the appearance of a web page.
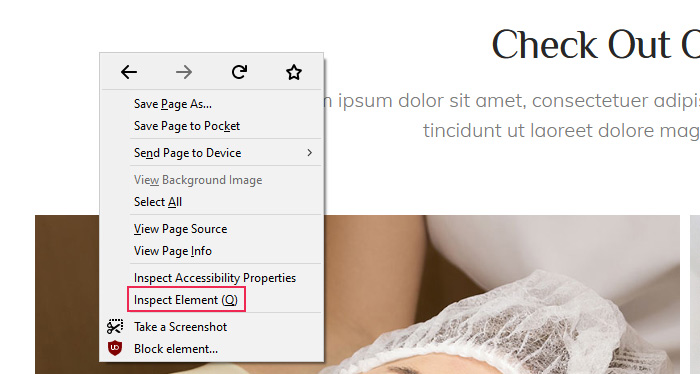
Bringing up the tools is as easy as pressing the F12 key on a keyboard if you have a PC – it works in any browser. You can also right-click and choose “Inspect Element.” If you’re using a Mac and the Safari browser, you first need to enable the Developer menu. Go to Safari > Preferences > Advanced, and then click the Show Develop menu in the menu bar box. After that, either use the right-click + Inspect Element or the option+cmd+i shortcut to bring up the tool.
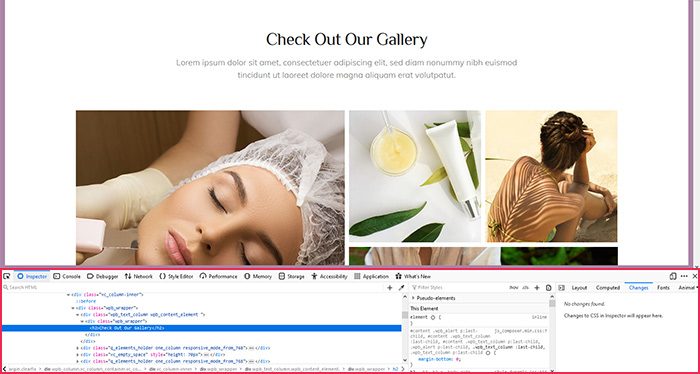
The subwindow that opens is where all the magic happens. It’s generally divided into two parts, the Elements panel where you can see and edit page HTML, and the other where you can see and edit CSS. There’s also a JavaScript Console you can access, as well as the Debugger.
Now, you must know that different browsers might have different options in their DevTools. There’s a heated discussion whether it’s Firefox or the Chromium-based browsers that have the edge, but either way, it’s important to remember that occasionally you’ll need specific browsers for specific things. For example, if you need a Console where you can toggle errors and warnings but also CSS and logging messages, you should use Firefox. Neither Chrome nor Edge has the option.
The other important thing to remember is that the changes you make in DevTools don’t create permanent changes to the website. The beauty of using them is that you can make real-time changes to your web pages without having to worry that you’ll accidentally break something. It’s a giant sandbox where you can try out things and, occasionally, find fixes to some issues. Now, let’s see some of the things you can do with this set of tools.
We’ll be using Firefox’s Inspect Elements tool, but that doesn’t mean you can’t do these tricks and tips in other browsers, too. They just might be available under different names or in different places.
Qode Themes: Top Picks
View Collection

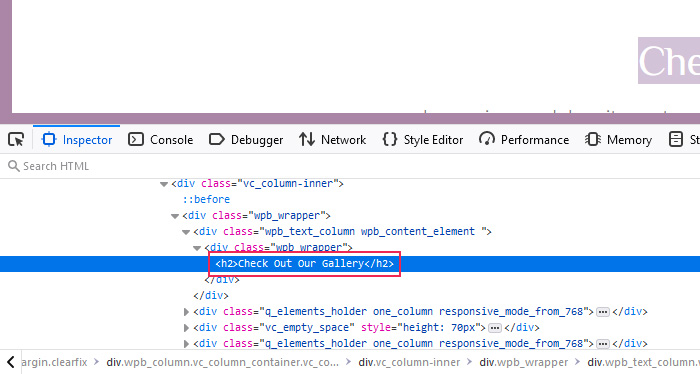
Let’s start with something simple. Go to your website, open any of its pages, highlight one of the headings you have on it, and then click the Inspect Element tool option. DevTools should open with the heading in question highlighted in the HTML inspector tool.
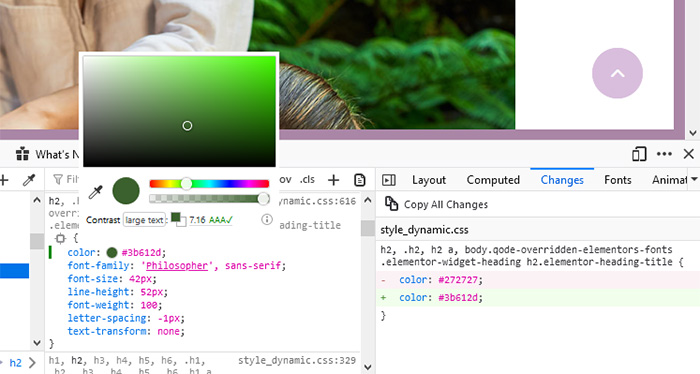
Even from there, you can start changing the contents of the website simply by changing the words in the header. But it might be even more fun to change the font, size, letter spacing, and even the color of the heading, and you can do all of that from the CSS editor part. Remember, none of the changes you make here are permanent.
Scroll down the Filter Styles window until you find the options for colors and fonts and have your fun. You can even use an eyedropper tool to color the subheading into another color you have on your website but you’re not sure what it is.
Do you want to see how quickly your website would load on different network speeds? Inspect Elements tool lets you do it. If you’re wondering how quickly your webpage would load over a 2G network, simply navigate away from the Inspector over to Network, find the No Throttling menu.
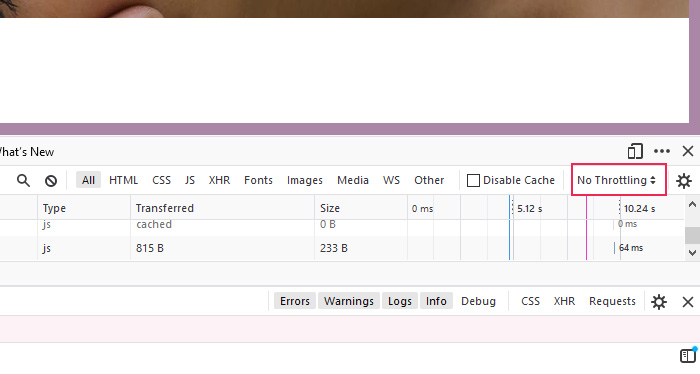
Open the menu and choose 2G. Reload the page and you’ll notice the sudden crawl. The option is present in Chrome, too – you can even create custom throttling profiles from the settings and bring them up when in the Network tab.

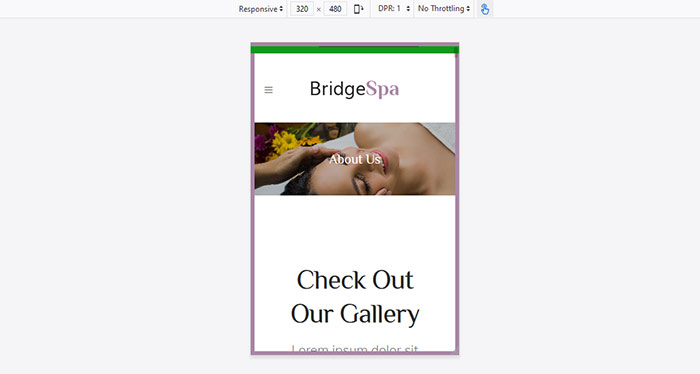
Every website developer needs a way to see how their website appears and behaves on a small-screened device. But as it’s still more practical to develop and design on a bigger screen, we have to rely on device emulators of sorts to help us see how it all would look on a smartphone, for example.
With the Inspect Elements tools, Responsive Design Mode is built in. You can switch to it easily by pressing the button next to the button that closes the Inspect Elements tool.
You’ll see your page as it looks on mobile devices. You can adjust the size of the screen, as well as throttling and touch simulation. In Chrome, you’ll find the Device Toolbar toggle – which lets you do the same thing – on the left hand side of the Inspector window.


In case you’ve missed it, the tool has settings of its own. You can access them by pressing the F1 key and choose the default developer tools, toolbox buttons, themes, inspector options, editor preferences, and advanced settings.
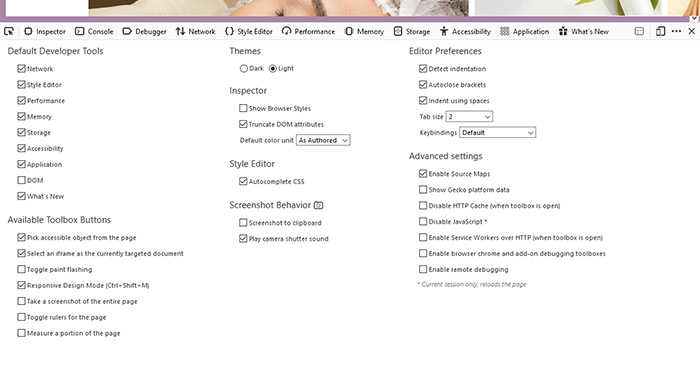
You should spend some time getting familiar with the options you have here. They range from the ability to switch between a dark and a light theme, to adding a screenshot button and disabling JavaScript.
Conclusion
WordPress already gives you more than enough power when it comes to shaping a website and its pages. But occasionally, or even more often, it’s good to have a way to try all kinds of things or find solutions to problems in a safe environment.
The browser Inspect Element tool does that for developers. DevTools lets you enjoy on a playground where you can completely change how a page looks or what it contains, without any consequence. Whether you’d do it to exercise creativity or make your website safer, you’d have to agree that the feature is more than useful.
